Report Table for Looker
A table visualization for single-page summary reports in Looker. Built for PDF exports, report packs, and financial reporting. Originally created by Jon Walls.
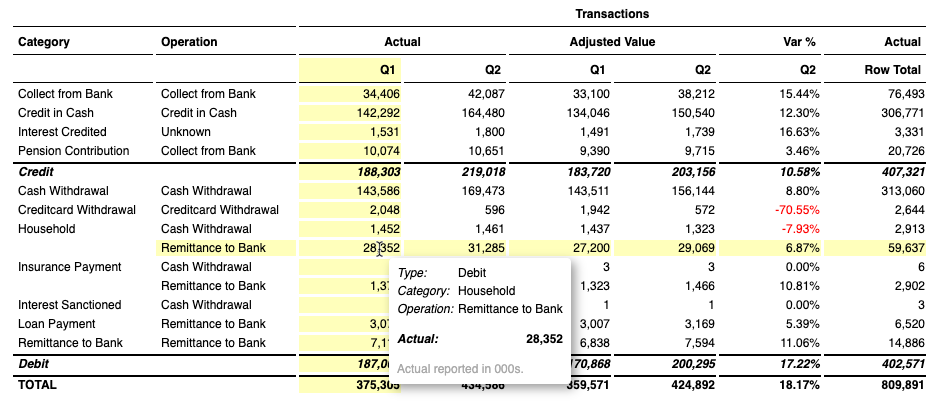
Features
- Quick variance calculations
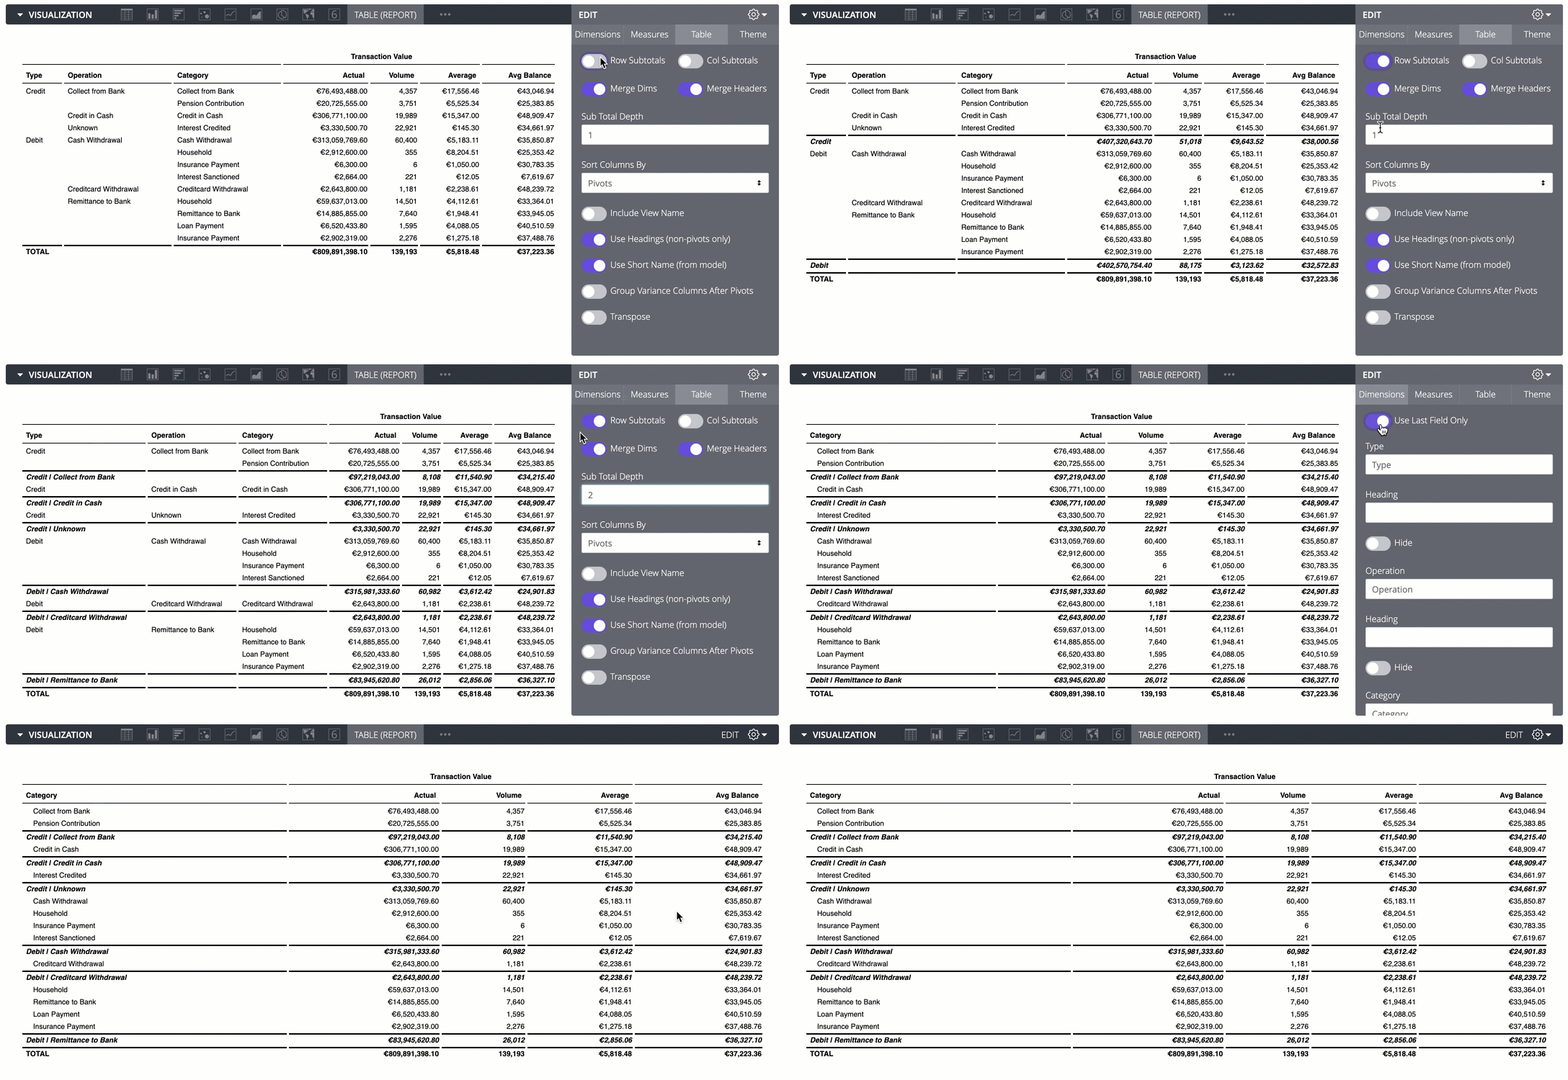
- Row and column subtotals (including two pivot levels)
- Uses Looker query subtotals when available, or calculates them on the client
- Header row for non-pivoted tables
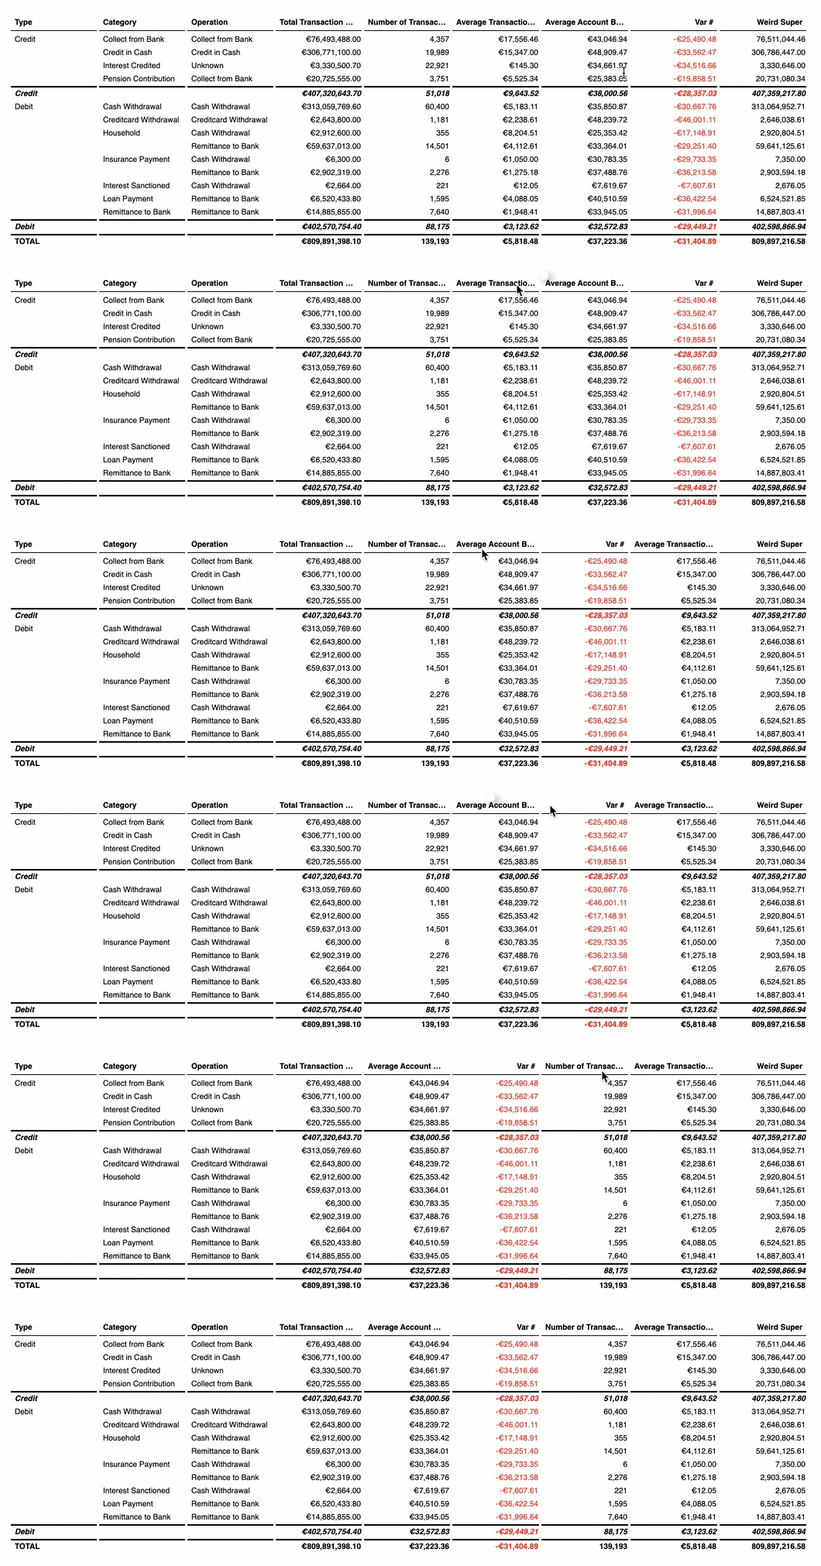
- Column reordering by pivot value or measure
- Drag and drop column reordering on flat tables
- Dimension transposition
- Red and black conditional formatting
- Subtotal formatting for highlighting transposed measure rows
- Custom CSS themes
- LookML tags for default abbreviations and headers
- Single dimension value reduction for financial reports
- Drill-to-detail support
Recent updates
- Added an "Allow Subtotal Toggle" (
allowSubtotalToggle) option that exposes a floating Sigma (Σ) action button on hover to show or hide row subtotals (hideSubtotals) on demand. - Added collapsed subtotals (
subtotalStyle: 'collapsed') with interactive expand and collapse row toggles (arrowStyle), hierarchy indentation, and combined header labels. - Added a "Subtotals on Top" setting to render row subtotals above line items.
- Added an option to freeze the first X columns during horizontal scrolling.
- Added support for dynamic field labels in Looker (
label_from_parameterand Liquid conditional logic). - Added a "Hide Null Dimension Columns" option to omit completely null dimension columns and suppress redundant subtotal rows for inactive hierarchy levels.
Installation
To install this visualization in your Looker instance, add the visualization parameter to your project manifest.lkml file:
visualization: {
  id: "lkrdev-report-table"
  url: "https://cdn.lkr.dev/viz/report-table/latest/report_table.js"
  label: "Report Table"
}
For more details on custom visualizations in Looker, see the Looker documentation on developing custom visualizations using a project manifest or managing Admin panel visualizations.
Standalone usage outside Looker
You can also use this visualization independently in non-Looker web apps by embedding the compiled report_table.js script and calling window.looker.table().
For integration details, method signatures, and payload data formats, see standalone.md.
Examples
Drag and drop columns for flat tables
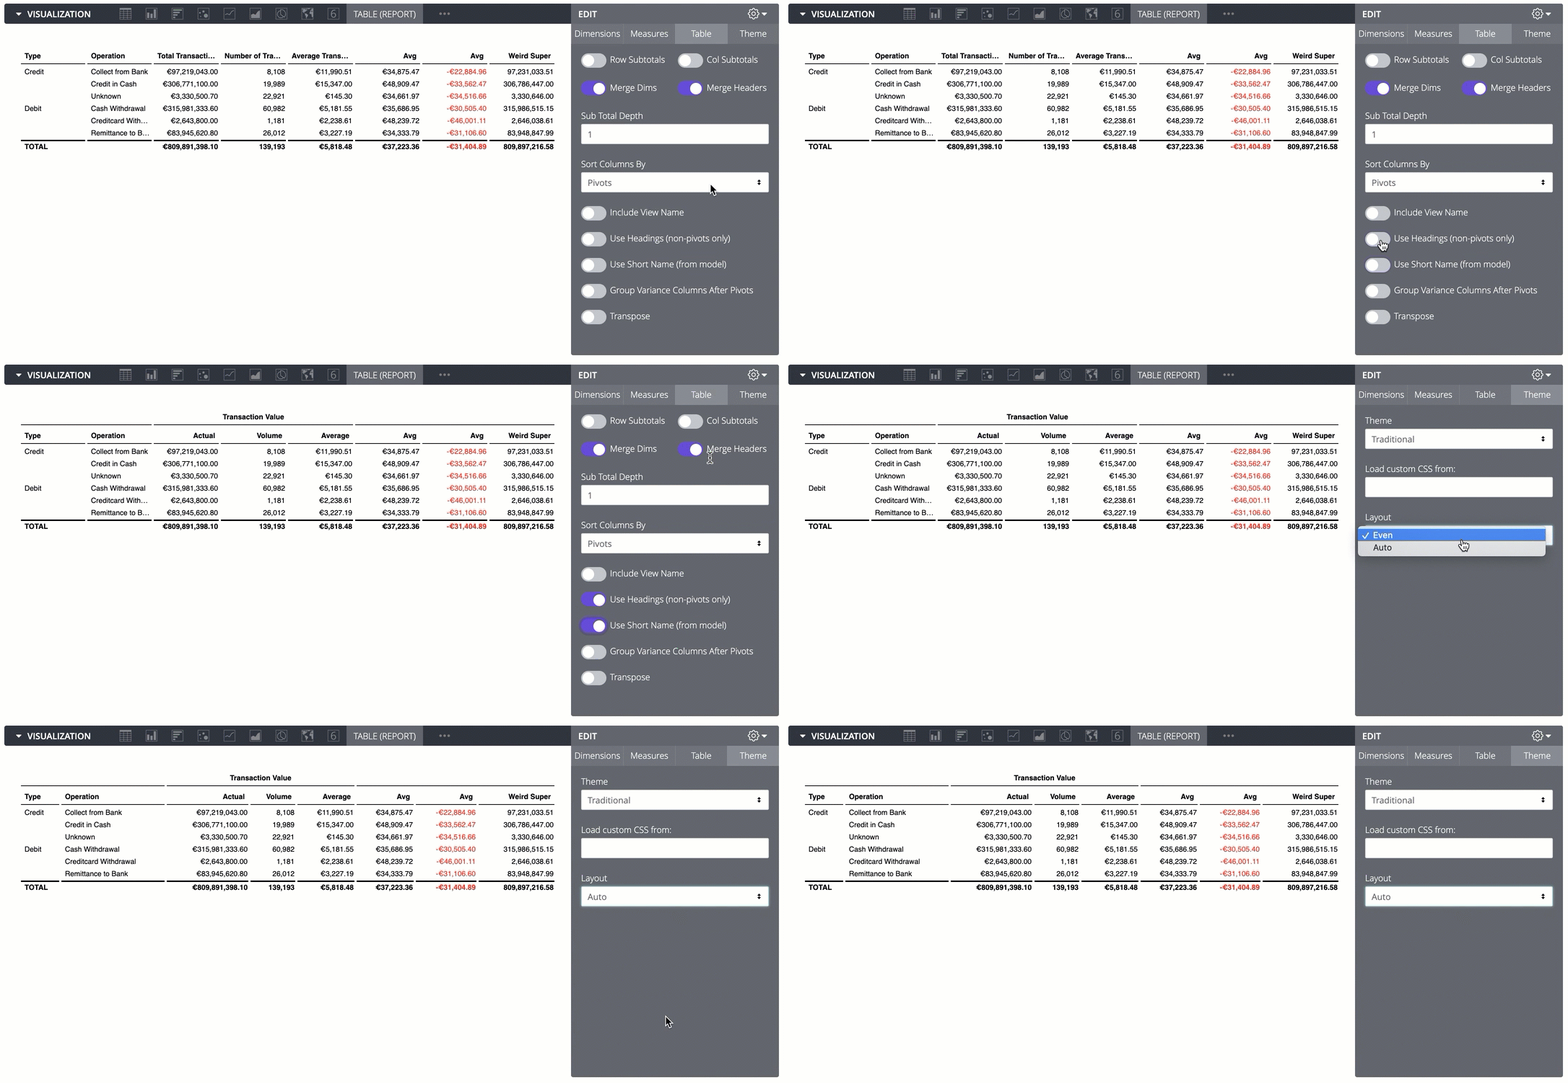
Tags in LookML for consistent headers and abbreviations
Subtotals and show last dimension only
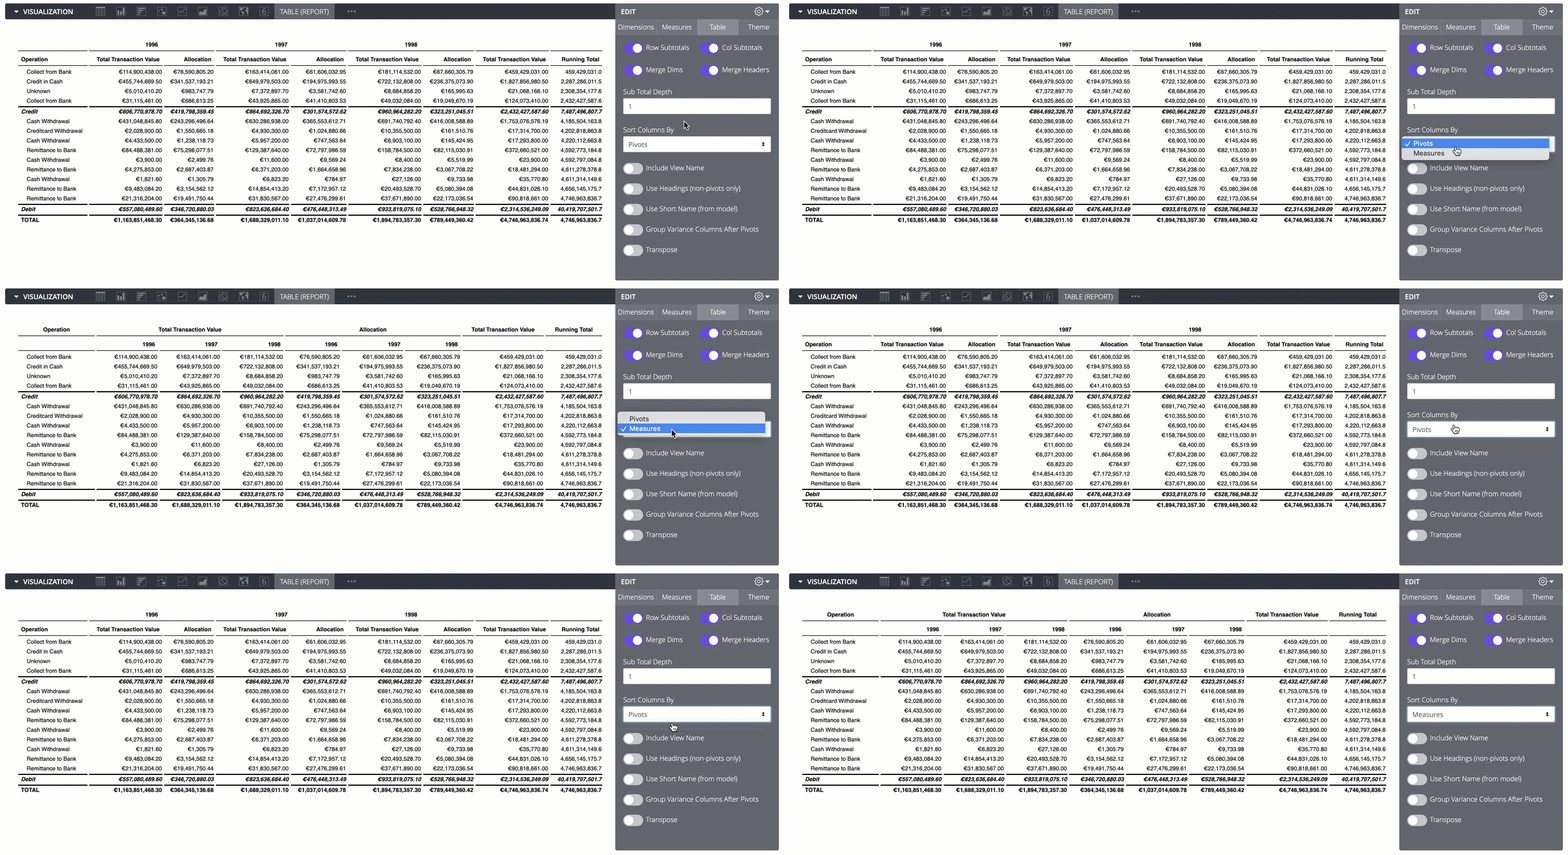
Sort by pivot or measure
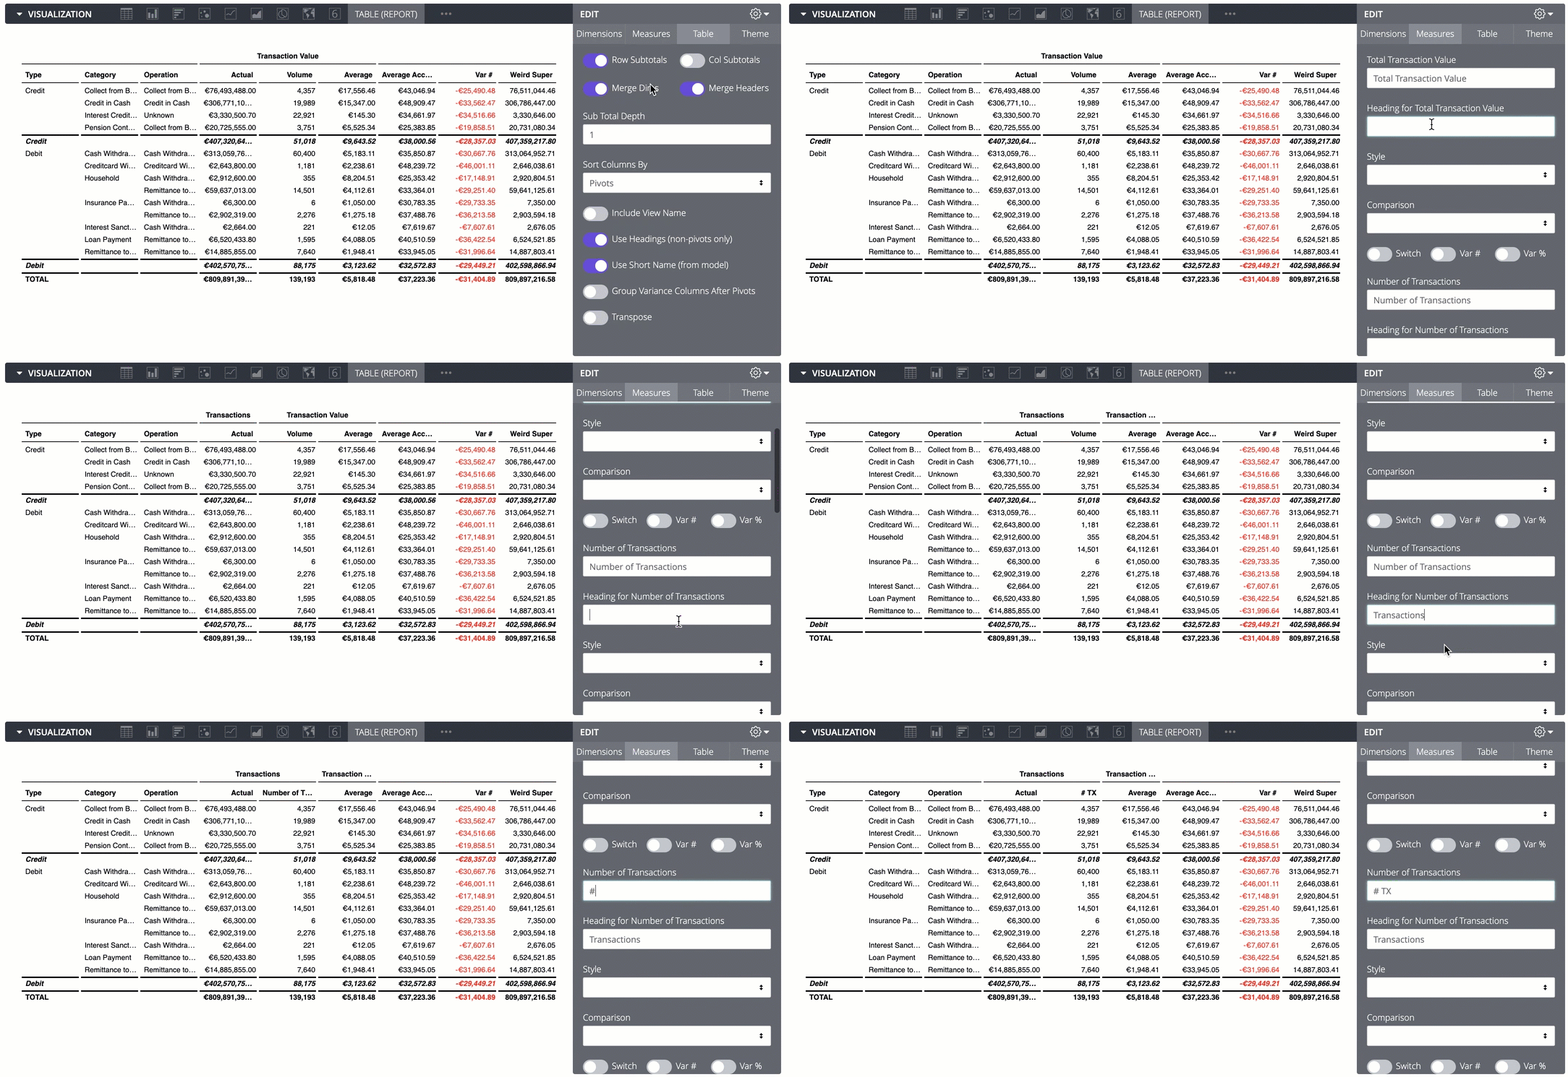
Set headers and labels
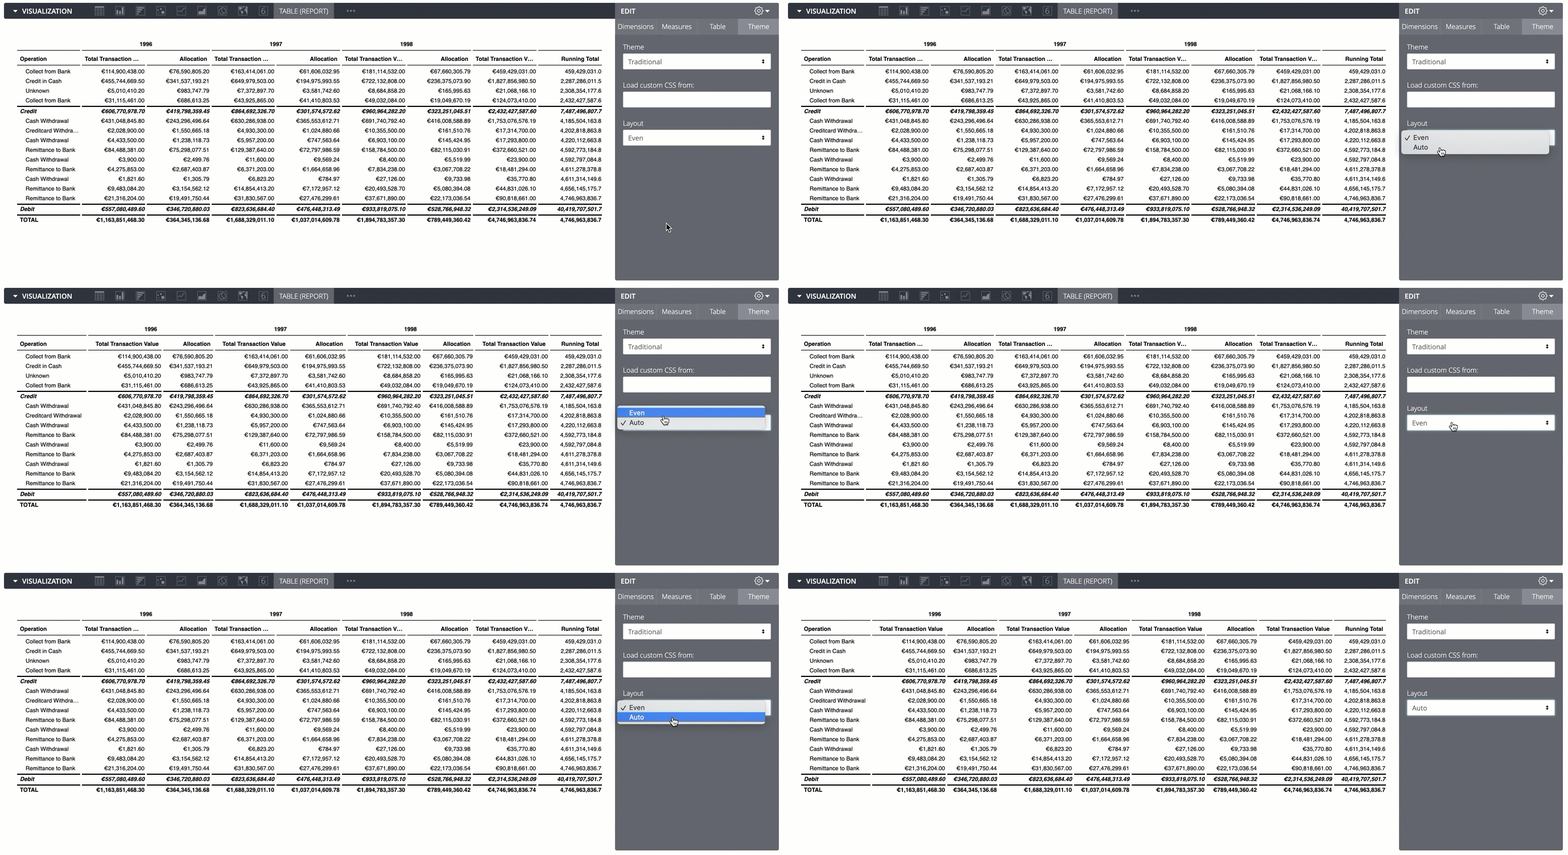
Even width columns or autolayout
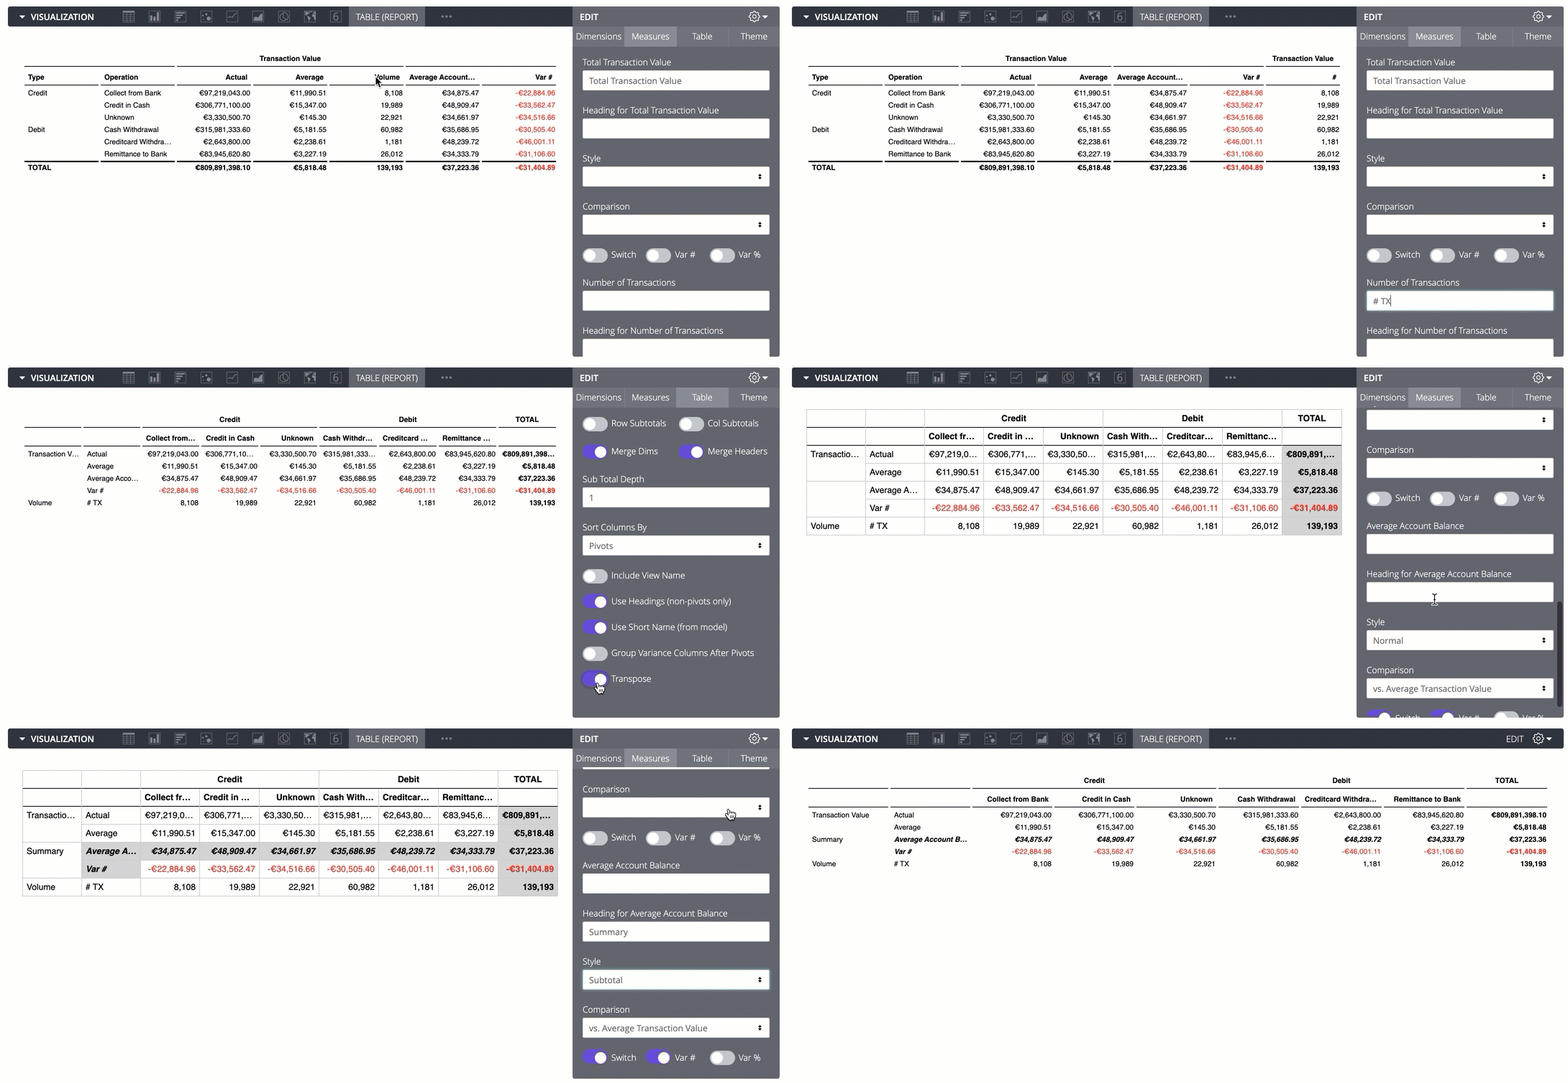
Transposing and financial reports
Collapsed columns and subtotals
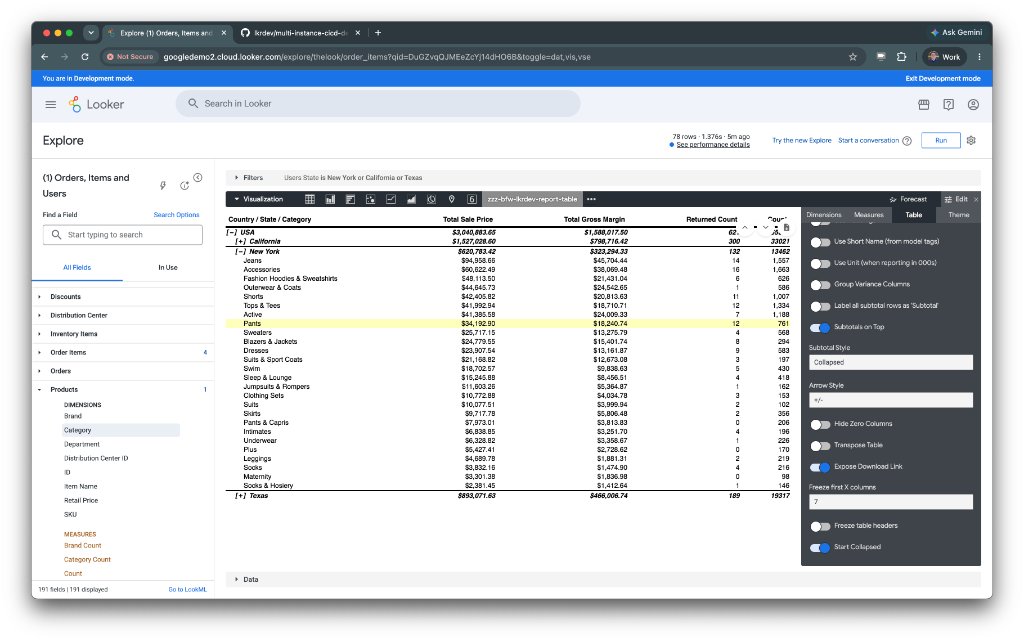
When working with multi-level hierarchies (such as Country > State > Category), standard tables often display repeated columns. With collapsed subtotals, multiple dimension columns collapse into a single hierarchical column with visual indentation and expand/collapse controls.
Configuration options
- Subtotal Style:
Simple: Standard multi-column layout with subtotal rows.Collapsed: Collapses dimension columns into a single column with indentation levels (subtotal-collapsed-0,subtotal-collapsed-1, etc.) and combines column headers (such asCountry / State / Category).
- Allow Subtotal Toggle (
allowSubtotalToggle):- When Row Subtotals (
rowSubtotals) is enabled, turning on Allow Subtotal Toggle adds a floating Sigma (Σ) button (#toggleSubtotalsBtn) to the top-right action bar when hovering over the table. - Clicking the button toggles
hideSubtotalsbetween showing and hiding subtotal rows on the fly without modifying the underlying query. - If Allow Subtotal Toggle is turned off, any hidden toggle state (
hideSubtotals) is ignored so row subtotals always display whenrowSubtotalsis active.
- When Row Subtotals (
- Arrow Style:
Arrows: Displays▲/▼toggle icons.+/-: Displays[-]/[+]toggle buttons.
- Start Collapsed:
- When enabled, collapses subtotal groups on initial render. Users can click any row toggle to expand or collapse child groups.
Dynamic hierarchies and null dimension suppression
Dashboards often implement parameter-driven dynamic hierarchies (such as Level 1: Country, Level 2: Cluster, Level 3: Collection, Level 4: None, Level 5: None).
LookML models typically implement this pattern with a parameter paired with dynamic dimension label_from_parameter:
parameter: select_level_4 {
  type: unquoted
  allowed_value: { label: "Product Category" value: "category" }
  allowed_value: { label: "Brand"            value: "brand" }
  allowed_value: { label: "None"             value: "none" }
  default_value: "none"
}

dimension: level_4 {
  label_from_parameter: select_level_4
  sql:
    {% if select_level_4._parameter_value == 'category' %}
      ${products.category}
    {% elsif select_level_4._parameter_value == 'brand' %}
      ${products.brand}
    {% else %}
      NULL
    {% endif %} ;;
}
When users select "None", the column header dynamically updates to "None" via label_from_parameter and its SQL values evaluate to NULL, but the dimension field remains in the query payload.
Without suppression, standard tables render empty ∅ columns with "None" headers and produce redundant subtotal rows that duplicate the leaf line items with trailing separators (such as Country | Cluster | Collection | ).
Hide null dimension columns option
Enabling Hide Null Dimension Columns (hideNullDimensionCols in the Table settings tab) adjusts the table dynamically:
- Hides empty dimension columns where all dataset rows contain
null,undefined, or empty string""values. - Suppresses redundant subtotals by calculating subtotal depths and groupings exclusively over active, non-null dimensions. For example, if levels 4 and 5 evaluate to
NULLin a 5-dimension query, subtotals generate only for levels 1 (Country) and 2 (Country | Cluster), treating level 3 (Collection) as the line item tier. - Adapts single-index column mode (
indexColumn) and collapsed subtotal mode (subtotalStyle: 'collapsed') to the active hierarchy depth without requiring separate Looks or dashboards.
Tagging fields in LookML
Grouping fields under headings and abbreviating column headers can be repetitive. The Report Table visualization picks up tags in the LookML model using the format "vis-tools:SETTING:VALUE".
Available tag settings include heading, short_name, and unit:
measure: number_of_transactions {
  tags: [
    "vis-tools:heading:Transaction Value",
    "vis-tools:short_name:Volume",
    "vis-tools:unit:#"
  ]
  type: count
  value_format_name: decimal_0
  drill_fields: [transaction_details*]
}
Notes
- Maximum of two pivot fields.
- Subtotals calculated on the client handle simple sums and averages.
- Count distincts, running totals, and custom table calculations rely on Looker query subtotals.
- The visualization uses subtotals from the query response when available.
- Tooltips alert users to estimated calculations.
Using custom CSS
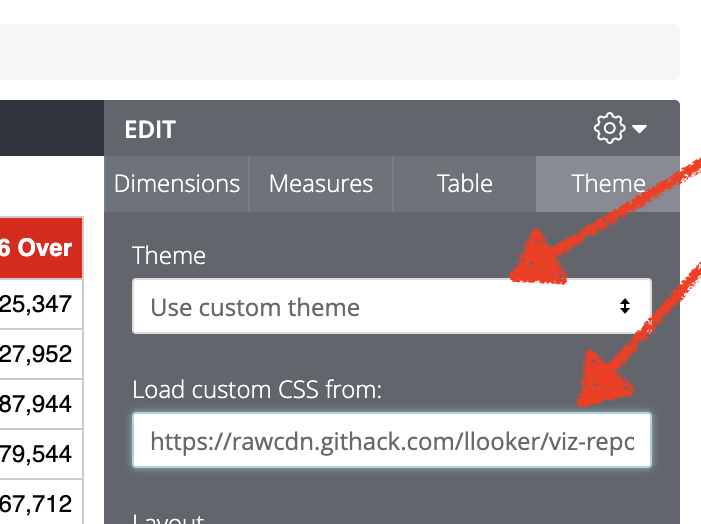
You can apply custom styling by providing a URL to a CSS file in the Load custom CSS from: setting and selecting Use custom theme in the Theme tab.
See src/theme_custom_template.css for a starting template.
Custom styling examples
Dark mode
.reportTable {
  background-color: #1a1a1a;
  color: #f5f5f5;
  border: 1px solid #333333;
}
.reportTable th {
  background-color: #242424;
  color: #ffffff;
  border-bottom: 2px solid #64b5f6 !important;
}
.reportTable td {
  color: #e0e0e0;
  border: 1px solid #2a2a2a;
}
.subtotal {
  background: #2d2d2d;
  color: #81c784;
}
#tooltip {
  background-color: #242424;
  border: 1px solid #444444;
  border-radius: 6px;
  box-shadow: 0 6px 16px rgba(0, 0, 0, 0.6);
  color: #f5f5f5;
}
Card layout
.reportTable {
  font-family: "Inter", Roboto, sans-serif;
  border: none;
  box-shadow: 0 4px 16px rgba(0, 0, 0, 0.06);
  border-radius: 6px;
  overflow: hidden;
}
.reportTable th {
  background: linear-gradient(90deg, #1a365d 0%, #2b6cb0 100%);
  color: #ffffff;
  font-weight: 600;
  text-transform: uppercase;
  font-size: 11px;
  letter-spacing: 0.5px;
}
#tooltip {
  background-color: rgba(255, 255, 255, 0.95);
  backdrop-filter: blur(8px);
  border: 1px solid #e2e8f0;
  border-radius: 8px;
  box-shadow: 0 10px 25px -5px rgba(0, 0, 0, 0.1);
  padding: 8px 12px;
  color: #1a202c;
  font-weight: 500;
}
Grouped and pivoted column targeting
/* Alternating pivot groups (such as QTD vs YTD) */
#reportTable td.pivot-group-even,
#reportTable th.pivot-group-even {
  background-color: #ececec;
}
#reportTable td.pivot-group-odd,
#reportTable th.pivot-group-odd {
  background-color: #ffffff;
}

/* Target a specific pivot group index directly */
#reportTable .pivot-group-0 {
  border-left: 2px solid #006b9b;
}
Targeting the last rows
/* Highlight the last 4 rows (such as summary or grand total rows) */
#reportTable tbody tr:nth-last-child(-n + 4) td {
  background-color: #f0f0f0 !important;
  font-weight: bold;
}
Alternating row shading
#reportTable tbody tr:nth-child(even) td {
  background-color: #f8f9fa;
}
#reportTable tbody tr:nth-child(odd) td {
  background-color: #ffffff;
}
Top-aligning table cell content
.reportTable th,
.reportTable td {
  vertical-align: top;
}
Targeting flipped subtotals
When the Subtotals on Top option is enabled, .subtotal-top and .subtotals-on-top classes are applied to #reportTable, subtotal rows (<tr>), and subtotal cells (<td>).
#reportTable tr.subtotal-top td {
  background-color: #e3f2fd !important;
  font-weight: bold;
}
Hosting custom CSS
To load external CSS into Looker, the stylesheet must be served over HTTPS with CORS headers (Access-Control-Allow-Origin: *) and a Content-Type: text/css header.
Direct links to raw GitHub files (such as raw.githubusercontent.com) fail because GitHub sends an X-Content-Type-Options: nosniff header with a text/plain MIME type. Pass the link through a proxy service such as jsDelivr or Githack, or host the file on Google Cloud Storage with public read access and CORS enabled.
Feedback and contributions
To report an issue or suggest an improvement, please submit a request at help.looker.com.
Development quickstart
-
Install dependencies:
yarn install -
Make changes to the source code under
/src. -
Compile the bundle:
yarn buildOr run the file watcher during development:
yarn watch
Project structure
./report_table.js: Minified distribution file.manifest.lkml: Looker external dependencies configuration file defining the visualization object.marketplace.json: Looker Marketplace package configuration.src/: Visualization source files.src/report_table.js: Main entry point for the visualization.tests/: Jest test suites.